✉️ Not subscribed yet? Subscribe to the Newsletter
Future of Coding Weekly 2024/12 Week 4
2024-12-23 10:16
🛡️ Unusual programming environment for counting 🎥 Incremental Graph Code 🏹 tldraw computer
Our Work
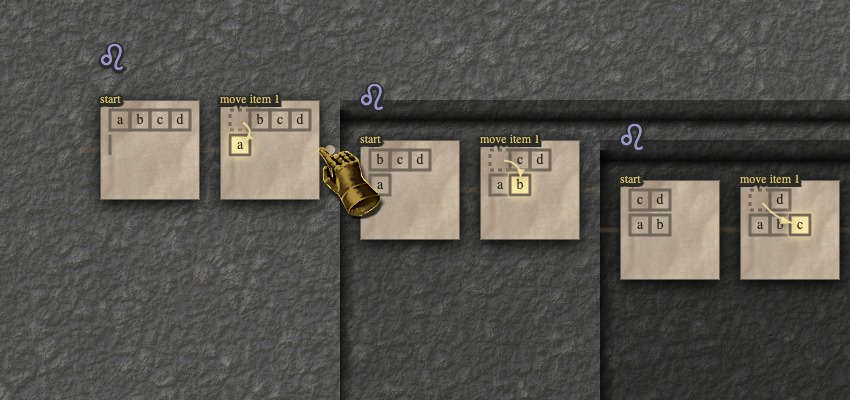
🛡️ Droste's Lair is an unusual programming environment for building and counting mathematical structures via Elliot
Joshua Horowitz and I invite you to explore our experimental visual programming environment (which takes place in a dungeon)
Features
-
dissolve the bounds of decision and explore all possibilities at once
-
use sigillic incantations, delve into recursive caverns

🎥 Incremental Graph Code (IGC) Introduction via Thomas van Binsbergen

This video demos a prototype that Max Boksem and I built to investigate a modular graph structure for representing and running source code . The tool allows you to create different projections out of the code such as code structure, documentation view, and execution history. The tool supports incremental and exploratory programming (multiple execution sessions) and "nested graphs" (importing a graph as a node) for hierarchical views. The work was presented at Splash earlier. See the paper here. Konrad Hinsen, this is the video I promised you a while ago.
Devlog Together
💬 Tom Larkworthy
There were some tricky problems to solve to get to this. Still glitching and a WIP, but finally piece number 3 is beginning to come together, a userspace notebook renderer inside a notebook, that works with the existing observable notebook cells, but whose layout state can be drastically different, and yet still persisted via single file export. All the pieces are reactively editable insider the notebook. The notebook state is the editor. There is no distinction between the development UI and the executing program, and its a single 1.2MB HTML file that works offline.
🎥 lopebook
Thinking Together
💬 Alex North
Does anyone know of any DSLs or similar that are specific to graph/chart drawing? I.e. a language that defines a function from data to image, specialised toward visualising data?
If not, what’s the closest thing? E.g. is there a JS chart-drawing library with an API that feels close to a DSL?
💬 Jason Morris
I have been working with large-ish knowledge graphs on and off over the course of the year, and I keep running into the same problem... my intuition for what I have done when I modify the graph and how it will effect everything else is just dismally bad. I make what seems like will be an incremental change, and it doesn't do what I expected, or if it does, it breaks all my algorithms. This happens with other data structures, too, obviously. But with graph data it happens far more often, as in nearly always, and the time between "it isn't working" and "oh, I know how I broke it" is much longer. So I'm wondering, assuming that my experience is not unique, is there something about graphs that makes them harder to grok? The absence of a clear serialization, the absence of order, complexity of structure? Or is it a UI problem, and if I could just see what I was doing it wouldn't be so bad... Often, when I come to a particularly hard problem, I sample and visualize the graph, and learn that the previous three problems were not correctly solved. So visualization helps, but is that enough? Or is there something fundamentally inhuman about large, dense graphs?
Content
🏹 tldraw computer via Maikel van de Lisdonk
computer.tldraw.com ... I think it's awesome! And I am a bit jealous but in a good way 😄 .. very inspirational and I think this is what the chatgpt canvas should have been
👨🏽💻 By 🐘 @[email protected] 🐦 @warianoguerra
💬 Not a member yet? Check the Future of Coding Community
✉️ Not subscribed yet? Subscribe to the Newsletter / Archive / RSS
🎙️ Prefer podcasts? check the Future of Coding Podcast